Discover the power of your data with portfolio performance
Portfolio Management provides a wide range of tools to aggregate and break down your portfolio data to provide you insights into where it is the best performing. Within Portfolio Management, there is no better tool than Portfolio Performance to visualise a breakdown of your portfolio.
Portfolio Performance is broken down into two tabs, Overview and Timeline. In this article, I will provide an overview of what is displayed within each section.

Overview
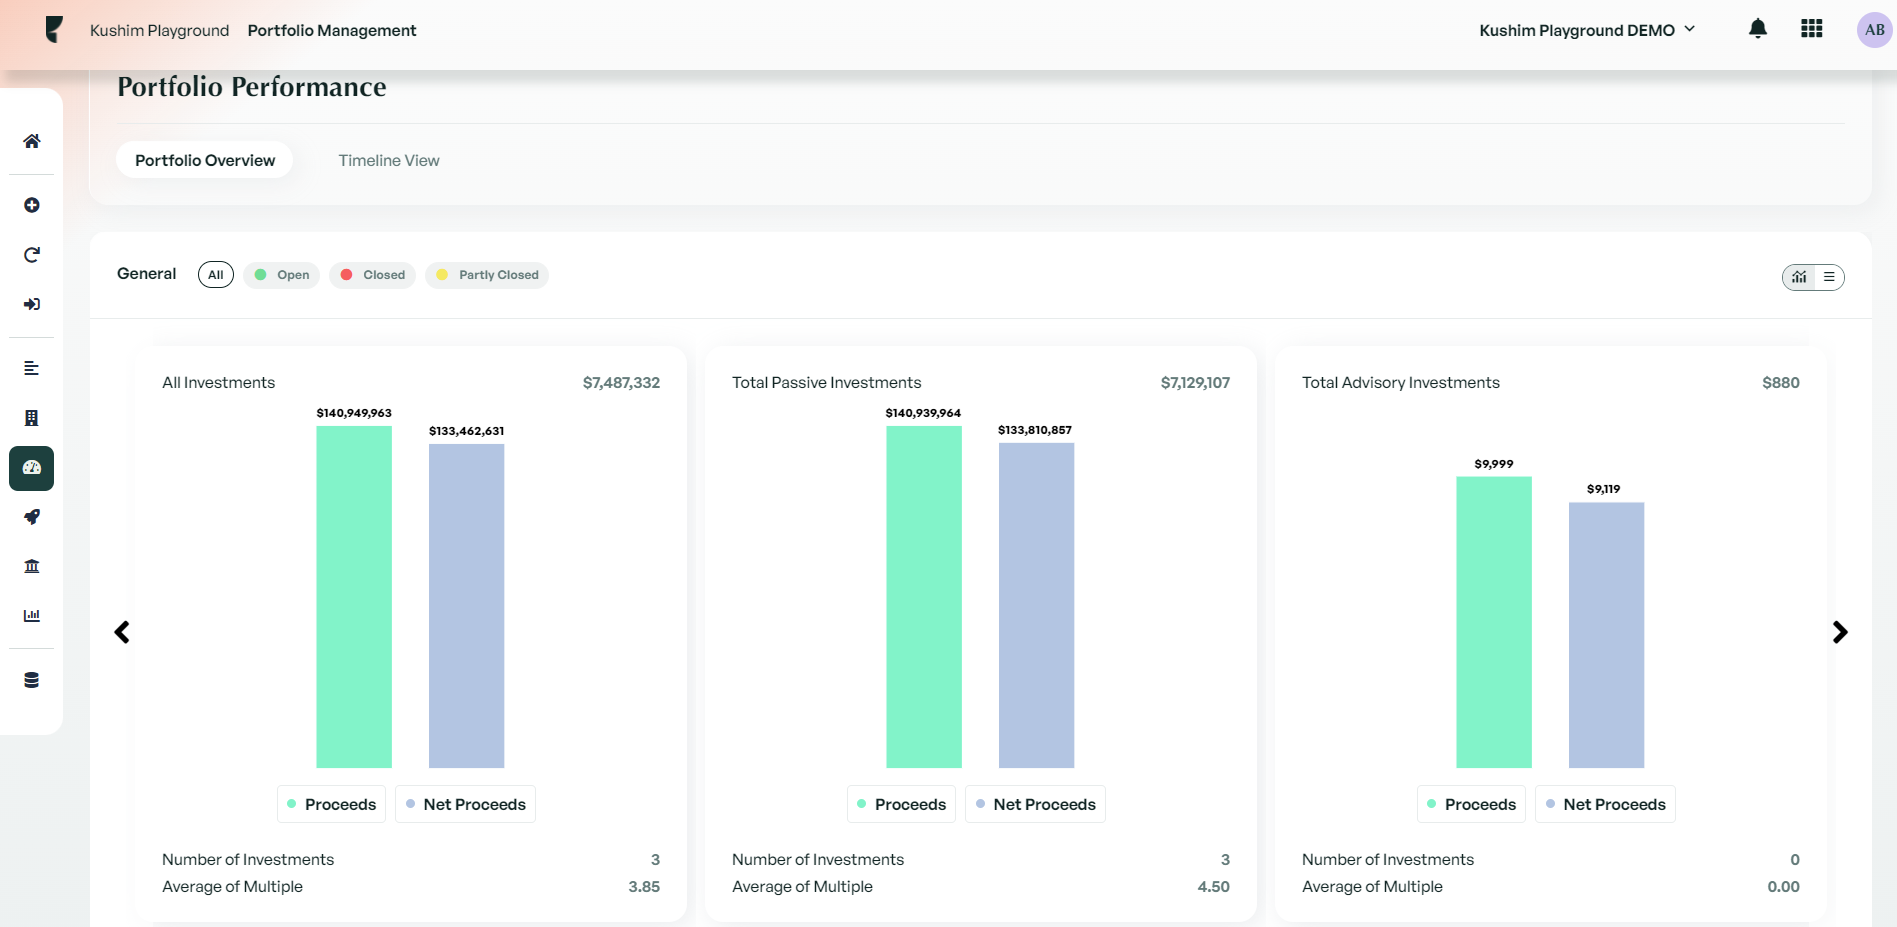
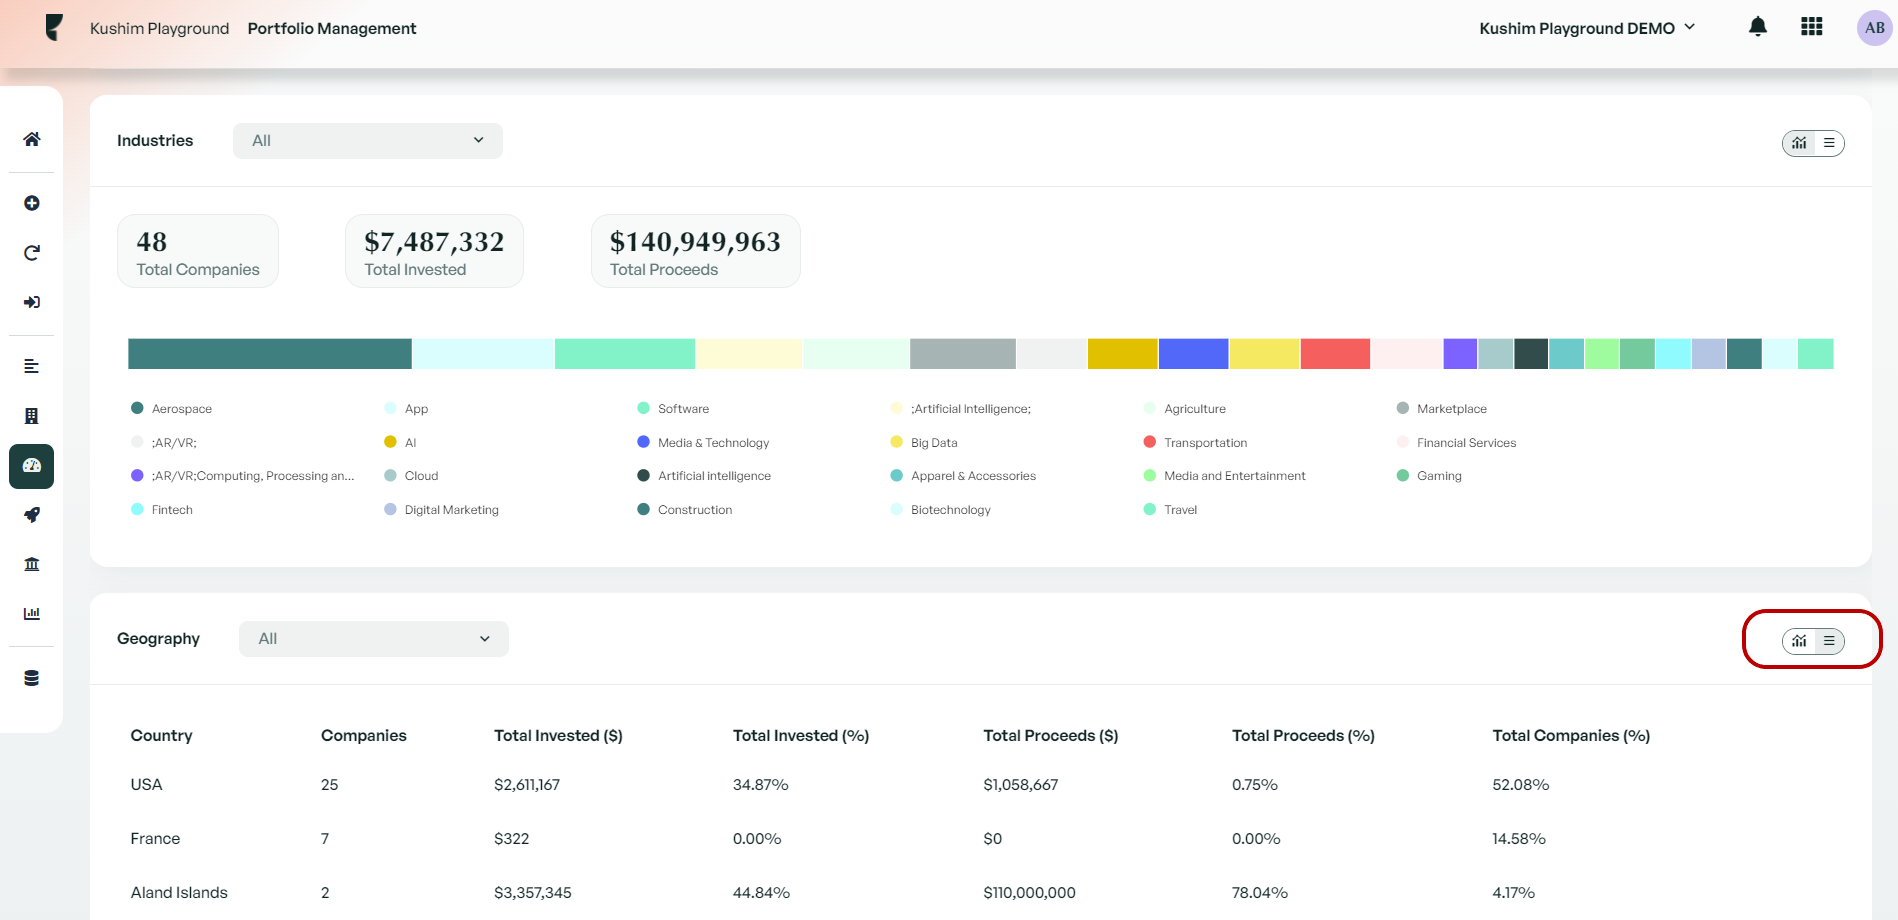
Within Portfolio Overview, you will find a breakdown of your portfolio categorized into 3 categories, General, Industry and Geography.
Each category contains both a visual graphic and a table view displaying how your portfolio is performing. There is a big difference between the graphic and table view with the graphic providing a basic breakdown of your portfolio. The table view provides a breakdown of your portfolio in a more precise and detailed view.
You can toggle between the graphic and table view by clicking on the toggle switch. Each category also contains a set of filters you can utilise to filter your data by the provided options.

Timeline
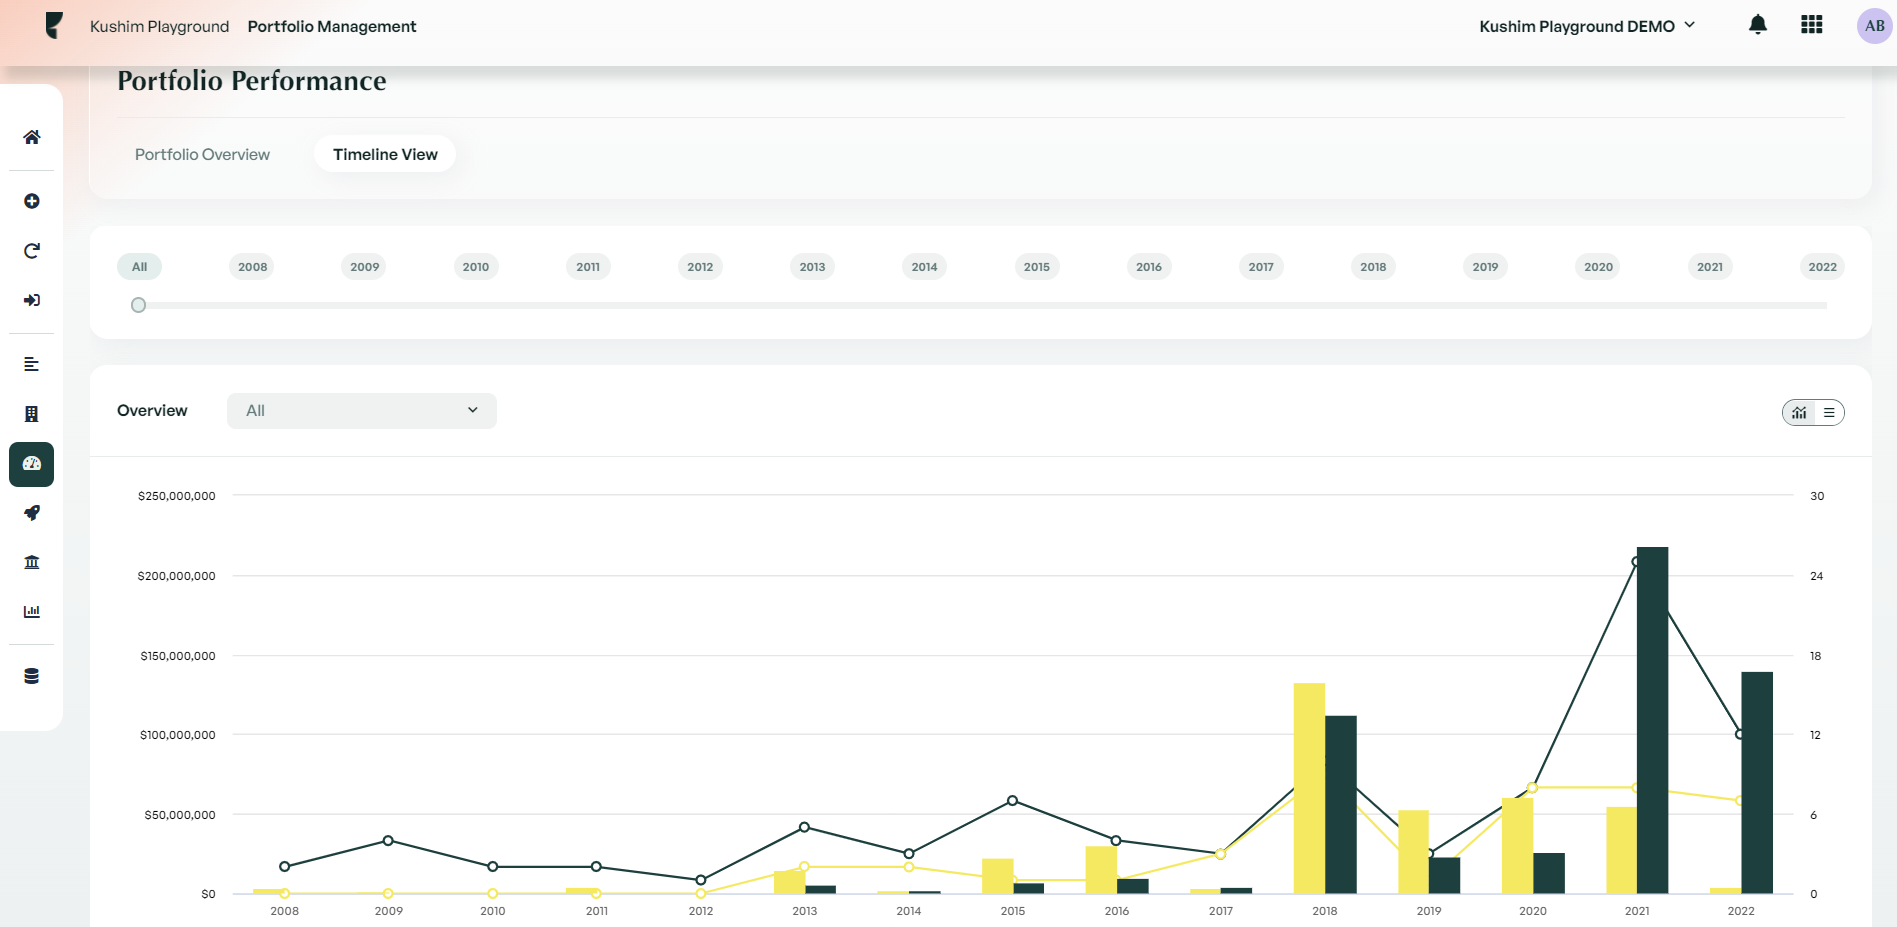
The timeline tab is split into three categories, Overview, Exits and Investments. As with the overview tab, you have the ability to view each category as either a graphic or a detailed table view.
The timeline view provides the ability to view your data by year. You can set the year through the interactable timeline at the top of the page. Once you have set a year, each category will update to display the data for the selected year.

We recommend for you play around with Portfolio performance and see what you can discover. Portfolio Performance is generated by Edda using the data of your investments and cannot be modified from within the tab.
If there is anything you need further assistance with, please contact our support team on the platform, we are always happy to assist.
